I'll be traveling this week, to a warmer climate for the winter. I wish everyone a Happy and Healthy New Year.
Remember, I've been looking for S&P 1136 for the 2009 high.
Moving Averages, Pivot Points and Gaps


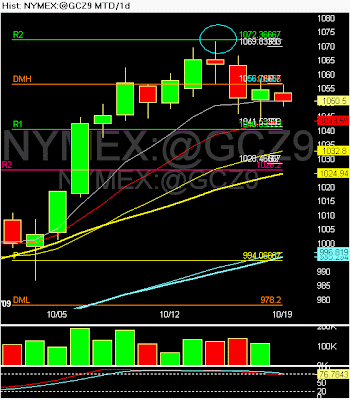
 Gold last week, was capped by the monthly Pivot(yellow line marked P) at 1141, and support was 1100. Gold has now pulled back 10% from the highs earlier in the month. Gold is making a bullish harami pattern, but needs confirmation. The short term trend is still down(long term is still up), but that may change this week if gold can break above the 20dma at 1156. I think gold will trade between 1156 and 1050. If 1120 breaks we go to 1156.....if 1085 breaks we go to 1050.


 If the Yearly s1 pivot was the low in 2009, will the yearly R1 pivot be the high? 1136?


 Last week , Gold's high was at the monthly R2 pivot(blue circle). R2 odds say that will be the high for Gold this month.


 For my Canadian friends: The Canadian Dollar(loonie) hit the yearly R1 pivot today(purple line R1). And the US dollar hit it's yearly S1 pivot today. Look for a pullback in the Loonie and a bounce up in the Dollar.
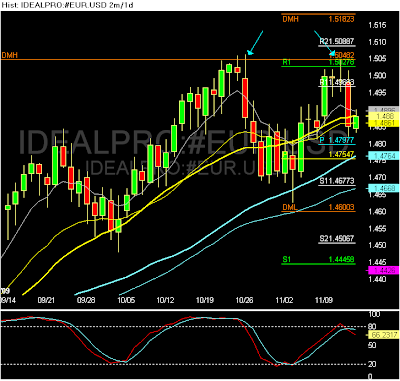
 UUP is the ETF for the U.S. Dollar index. It is testing the yearly S1 pivot here. Look for the U.S. Dollar to bottom here and the Euro to top out at 1.4737, which is the Yearly R1 pivot.
 S&P has now entered the gap zone from last October (see blue arrow on chart). Typically the gap gets filled. But we are also at the monthly 20 moving average too(see earlier post on the 20 month moving average).
 December Gold is very close to it's yearly R2 pivot(purple line marked R2) at 1026.2, and it's 2008 high at 1033. Be careful of double tops!
 Natural Gas is now up 50% from my bottom call, several days ago. My target is $3.94 at the monthly R1 pivot(green line marked R1). Monthly S1 is where I made the bottom call.
 Natgas closed at $3.25 today........up 30% in 1 week, since my bottom call last week on the monthly S1 pivot. 1 natgas mini futures contract(QG) costs $1500 and pays $25 per penny move. If you would have bought 1 at Ms1, you would be up $2000.......... Pivots are a traders best tool! They tell us where the risk vs reward is the greatest, and when we are wrong, so we can take small losses.

 Gold is testing the Monthly R2 pivot at $995.63. Will the monthly R2 pivot stop the run? There is an 80% chance that it will. Trading is playing probabilities. Pivots give traders the best odds.
 The NDX 100/QQQQ and NQ futures opened at the R1 pivot this morning, as seen on this 5min intraday chart, and came down to the S1 pivot for almost 20 points(see blue arrows). My favorite play is to short R1 on the open or buy S1 at the open(if price is there), for a quick trade. The best trades are in the morning from 8:30am est to 12:00 noon est., and then the market goes into chop for 2-3 hours. The last hour of the day, is when the professional money mangers come out to play.
 The S&P 500 could not close over 1033 as per my post last week. We now have the pullback/correction I'v e been looking for. Is this the start of a big melt down like last year? Maybe, but probably not. I think we go down to the yearly pivot(yellow line marked P) at 975. The monthly s1 pivot could provide strong support at 986 too, but watch 975. We break that and then 950 is next support. 1013 is next resistance above and can be shorted with a 1018 stop loss.
 Freddie Mac ran into the yearly pivot(yellow line marked P and blue arrow) last Friday, and today is starting to selling off. Smart traders used the yearly pivot to book profits and some traders went short there.

 The S&P ran into the monthly R1 pivot(green line marked R1) this week at 1033 and cannot close over it. Now were getting a small sell off that should take us back down to 1000- 1005 and fill the open gap(blue arrow) there.
 The S&P bounced off the yearly S1 pivot last March(blue circle). Will the Yearly R1 pivot be it's high at 1225, or the open gap at 1100?
