
Monday, November 18, 2013
Tuesday, November 12, 2013
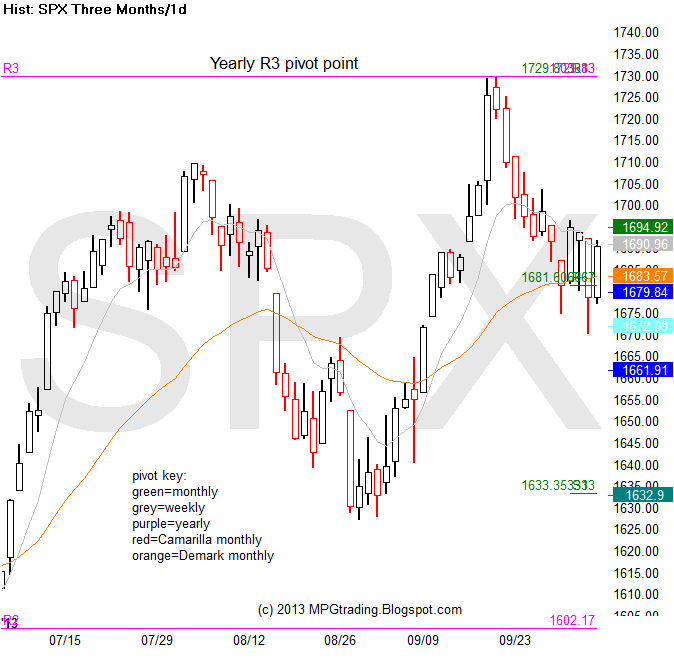
Yearly R3 pivot been resistance

For the past 10 days Woodies Yearly R3 pivot point has stopped the rally. Until we breakout over $177.63, there's a chance of a pullback to the $173 gap. In 2012 Woodies Yearly R pivot was the high of the year. There is a 84% chance that this could be the HOY too. The yearly R4 pivot is at $182. Since 1970, the S&P has gone to the YR4 pivot only 4 times in 43 years. 3 of the 4 times it was the High of the year(HOY).
Thursday, November 7, 2013

Sunday, October 20, 2013

Sunday, October 13, 2013
YM gap filled

the YM found support last week near the monthly S1 pivot and exactly 1,000 pts from the Sept high. Then rallied up to fill the open gap from 9/27. Tonight we gapped down 125 pts. The YM needs to close above 15,000 to keep last weeks rally party going.
Monday, October 7, 2013
Apple going to $549

Saturday, October 5, 2013
the yearly R Pivots stop the rally AGAIN!
Last April when the S&P 500 tested the yearly R2 pivot at 1600, it got a 60 point pullback. Last Thursdays low at 1670 was 60 points below the yearly R3 pivot. Coincidence? NO! market makers, banks, Quants and Algos ALL use pivot points. I have been warning investors & traders all summer to watch 1730 for MAJOR resistance. Remember, the high of the year in 2012 was also at the yearly R3 pivot. Below is the 2012 chart.

Sunday, September 22, 2013
Be careful this week

Wednesday, September 18, 2013
S&P testing Yearly R3 pivot

Once again, the yearly R3 pivot stopped the rally. In September of 2012, the yearly R3 pivot was the high of the year. Repeat?
Monday, September 16, 2013


Tuesday, September 10, 2013


Tuesday, August 27, 2013
Sunday, August 18, 2013
Apple yearly S1 to the yearly P?

I didn't hear ANY pro's on TV or in the news saying buy Apple at $390. I was one of the few who said "Buy Apple on the yearly S1 pivot($390)" back in April and June. Now its back to over $500. My target is the yearly Pivot at $547. It could get there by the Sept. 10th new products announcement.
Dec. Gold at MR1 and gap filled

December Gold futures rallied last week up the open gap and the monthly R1 pivot point. I don't see gold prices going above the monthly 50pma / yearly S2 pivot at $1430 this year. The 10 year trend is broken!!
probably more downside ahead

The S&P 500 had a big gap down last Thursday(the bigger the gap, the bigger the trap). It closed the week below the monthly pivot point. Next area of support is 1650. A close below that will open the door for 1625 gap and monthly S1 pivot. Resistance this week is old support at 1665/1666 ish.
Monday, August 12, 2013

Sunday, August 4, 2013
NDX looking 4 the Yearly R2 pivot


ZN IHS pattern

Tuesday, July 30, 2013
Yearly R1 stopped CL oil rally

I tweeted this chart last week when CL was at $108+ to be careful buying up, and to look to short on a break of the 9dma.
no change from last week

Monday, July 22, 2013
Indu still resistance at YR3

Sunday, July 14, 2013
Will we make new highs?

Until we close above the May 22 high, we have the potential for a double top reversal. If we do close higher look for resistance at 15722(MR2) pivot or Woodies yearly R3 at 15785.
Thursday, July 11, 2013

Wednesday, July 10, 2013


Tuesday, July 2, 2013


Sunday, June 30, 2013
50 day failure

Last week the S&p and the Dow went up to test the scene of the crime. The 50 day moving average(blue line). It was support for the first 5 months of the year. Now it is resistance. Twice last week the bulls could not break through it. There are open gaps at 1587 and 1622. The weekly Pivot is at 1588, and the July monthly pivot is very close to 1600. The astro guys are saying this week could be a very whippy where "no support or resistance level is safe". I feel we will see a test of the July monthly S1 pivot point at 1550 sometime this month. Watch 1550-1622 this week.
 The Dow Jones index(INDU) went from a high this year at the yearly R3 pivot to a low last week on the yearly R2 pivot. Price moves from pivot point 2 pivot point!

Monday, June 24, 2013
Yearly R3 to Yearly R2?

update 6-25: Mission accomplished as the Dow bounced off the Yearly R2 pivot on Monday. In fact it was the low of day on Monday. Sold my puts(1550) and bot some calls(1600) there).
Sunday, June 16, 2013
Quad Opex week

1600 is the line in the sand that most investors/traders are watching. Since 1600 was pinned last week does 1650 needs pinning this week? or 1700? or 1575? We will know Wednesday when the Fed meets. We also have a Bradley Model turn date coming up this weekend. be careful with new long positions.
Sunday, June 9, 2013
price moves from pivot point to pivot point


S&P last week went from the weekly Pivot(P) down to the weekly S2 pivot/yearly R2 pivot and bounced. Also there was an daily S1 pivot at 1598. The INDU/DJI did the same Wpp-Ws2 -wpp also.
Saturday, June 8, 2013
Possible melt up in the next few weeks

We got the pull back I had been looking for and it bounced at our target. How far will this bounce go is the question. I don't know the answer, maybe the Bradley Model does? The Bradley Model(below) shows a H&S topping pattern around June 22. It shows a very fast vertical rise after a pull back in early June. We just had a pullback to the YR2 pivot & open gap, right? If the Bradley Model is correct, the S&P could melt up to 1720(YR3)-1805(YR4) in the next few weeks (you want some of what I'm smoking :)) or we could go back down to 1600 for Quad opex on 6/21. March Quad Opex closed at 1550. The reason I choose 1720 is the SPX found support last week on the yearly R2 pivot, and the Yearly R3 pivot is at 1720(see above chart). It probably is a long shot. The largest open interest on June ES futures options is at 1550 & 1700.

The 2013 Bradley Model shows a major trend change in the next few weeks(within a week +/-). The current trend has been up for the past 6 months, since the Models last trend change date. That should mean the new trend will either be sideways or down into Oct/Nov.. The next Pluto-Uranus square is on November 1st.(last one was May 20). My guess is we will start a down trend in late June/July/August that will end in late Oct. early November per the model's 2013 siderograph. The dates on the bottom of the graph are not correct. The vertical lines are the 1st of the month.

Several other well know Financial Astrologers are saying that the highs this June will stand for a few years. They think we will see a 1-2 year bear market starting this August 2013.
Tuesday, June 4, 2013
NDX yearly pivots and 20 month ma

the past 4+ years, NDX has been finding support on the monthly 20 moving average(yellow line) and has never gone below the yearly pivot point(P) for more than a few days. This years yearly R2 pivot is at 3186. Support is at the yearly pivot at 2616 or the 20 month ma at 2665, per the chart above.
Monday, June 3, 2013


Friday, May 31, 2013
Tuesday, May 28, 2013
double top test this week?


Wednesday, May 22, 2013
Yearly Pivots stopped the rally


Monday, May 20, 2013
June YM @ YR4

Wow, 1666.....1000 point rally off the lows in March 2009 at 666.Thats when I started this blog. The blog archive shows that I was very bullish back then felt the market had hit bottom. I am not bullish anymore. Today is the 1st of 2 Pluto-Uranus squares in 2013. The Last one was on sept. 19, 2012 and that was the high of the year for the Dow and S&p. The YM futes are at resistance here at YR4 and the ES futes is also at resistance at YR3. Will this finally be the week the market will take a a break? The Bradley Model is calling for a trend change in the next 30 days. I feel a top is close. S&P may go to YR3 at 1730, if we break the resistance pivots we are currently at.
Thursday, May 16, 2013
Es yearly R3

ES futures testing the yearly R3 pivot point. The high in 2012 was at the ES yearly R3 pivot last fall. It also happened near the Pluto-Uranus Square on Sept. 18th. We have Uranus-Pluto Square coming up on May 20th. I am not saying the high for 2013 is in. We still could go to the SPX cash index YR3 at 1730. I am looking for a pull back here. I am also looking for a top anytime in the next 6 weeks, with a big correction going into October, per the Bradley model.

Subscribe to:
Posts (Atom)
