

Wednesday, December 19, 2012
ES monthly R1
Tuesday, December 18, 2012
XLF @ YR1/CAM H4

Monday, December 17, 2012
Gold double bottom on YR1

UPDATE: the YR1 pivot broke. Next support is at the monthly S2 pivot at 1633.75 or the yearly Pivot point at 1627.
Apple

Apple hit $497 today in pre market. That is the 400dma(monthly 20), the yearly R2 pivot point and Demarks monthly Low pivot point. I think AAPL may bounce here. Next support level below is on the monthly S2 pivot point at $467 and the 500dma is there too. A close below $497 will be the tell.
Friday, December 14, 2012
Bradley Model 2013

Here is a sneak peak at the 2013 Bradley model. As you can see a new trend change is coming around Dec 22/Jan 29th and will last until the June 2013 Quad opex. Will it be up like the sidergraph shows or will it be down? It can go either way. There is no polarity, it just shows when the trend will change and how long it will last. Either way 2013 will be big!!
Wednesday, December 12, 2012
Head and shoulders top in the making

XLF -Yearly R1 pivot and monthly R1

I am watching for a head and shoulders top at the yearly R1 pivot point at $16.48 or at the monthly R1 pivot point at $16.28. I'm looking for a big pullback to start soon.
Tuesday, December 11, 2012
Dow kissing the Yearly R1 pivot

V shape bottom

No double bottom or inverse head and shoulders bottom,,,,,,,, a V shape bounce trapping shorty!! We are approaching a supply area here at 13200-13250-13300 from last October. The low this month has been on the monthly pivot points on all the indexes. If the MPP is the low we probably will rally to the monthly R1 pivot point at 13385 on the Dec. YM futures and 1452 on the Dec. ES futures. We have a Major Bradley trend change date coming up next week. Will it be the beginning of a big pull back or a break out to new highs?
Thursday, December 6, 2012
Feb 2013 Gold futures pivots

Here are the yearly and monthly pivots for the front month on Gold(GC). As you can see Gold's high last October 2012 was at the yearly R2 and has now pulled back to the yearly R1 pivot point. Look for a possible double bottom here at 1666-1675. If that breaks then watch 1625-1650 for support.
Monday, December 3, 2012
New Dec pivots

New month brings new monthly pivots. The ES(s&p futures) should trade up to MR1 at 1451 and 1st support comes in at MS1 at 1360. Watch the 76 fib at 1436........ that could spoil the party.
 Here are the New December monthly pivots for the YM(Dow Jones futures). 13372=Mr1 and 12555=MS1. The 50 dma at 13100 may spoil this party.

Friday, November 30, 2012
3 weeks from today 12-21-2012
The Mayan calendar ends 3 weeks from today and we have Quad Opex and a major Bradley turn date there too.
My feeling is if we rally into quad opex then we probably will fall of the fiscal cliff and crash in 2013. If we sell off into quad opex then we should see resolution to the fiscal cliff and a big rally will start. If we go sideways into quad opex, then it is anyone's guess. None of this will matter if the Mayans are right!!
Monday, November 26, 2012
ESZ2 MS2 to MPP

What a V-shape bounce we got last week.....up 65 points in 4 days!!! I was looking for a buy signal on the MS2(1349) pivot and we got one. December ES is now at the 50% Fib from the HOY to the Nov lows. We've gone to far too soon and the moving averages below need to catch up. Look for some consolidation this week and possibly a pull back to 1390, before we go retest last springs high at 1422(Mpp) and the 50 dma. Buy the dips as long as 1390 holds.
Thursday, November 22, 2012

Monday, November 19, 2012
Monthly S2 held

The bears could not close below the Monthly S2 pivot point at 1349 last week. Look for a rally this week back to the MS1 pivot point at 1375.5-1380.
Thursday, November 15, 2012
YR3 to YR2/Ms2

Wednesday, November 14, 2012

Monday, November 12, 2012
Monthly S1 pivot point support?

This is OPEX week. December YM did a doji on the monthly S1 pivot point last Friday. We could bounce here. Watch for a gap up open for confirmation on Monday. We should pin 13,000 this week and possibly 12.500. ES 1350 and 1400 strike prices.
Friday, November 9, 2012
YR3 to YR2

Thursday, November 8, 2012
is there still hope for a Holiday rally?

4 years ago, the day after Obama won the election, the market fell 5%. Yesterday was pretty ugly! We broke through the 200 day(white line) and came back down to the Camarilla yearly H3 pivot point. The monthly S1 pivot and the 50 weekly moving average(green line's) are the next support zone 12800ish. Resistance is now at the 200 day above at 13k-13050. There still is hope that we can bounce off the weekly 50 and and fill some gaps above at 13300 in the coming weeks. The high of this year now looks like it is in at 1475 on the S&P and 13700 on the Dow Jones.
Wednesday, November 7, 2012
Apple weekly 50

Apple has pulled back to the weekly 50 which has been support the past few years. Good risk reward here.
Monday, November 5, 2012
Looking for a rally this week

Friday, November 2, 2012
November stats
Per the Stock Traders Almanac, November is the #2 best month of the year for the stock market. During Presidential Election years, November is the #1 best month.
Also late October has been a good time to buy beaten down tech stocks! Apple needs to hold the 200dma. Open gap 585.
These are not long term trades!!! I still feel we could crash and burn in 2013 if we fail to make a new all time high of 1576+. This rally could run into December Quad opex(12/21). S&P 1530(yearly R2 pivot point) is my target. At Dec Quad Opex(12/21) I want to go short going into the end of the year. Next major Bradley Model turn date 12/22/2012.
12/21/2012 is also the end of the Mayan long count calendar. Not the end of the world.
12/21/2012 is also the end of the Mayan long count calendar. Not the end of the world.
Sunday, October 28, 2012
Trick or Treat? Full Moon reversal?


The Dow Jones Monthly S1 pivot point held as support last week and the 13050 open gap got filled. The 200 day moving average is just below and should provide short term support, along with the Full moon on Monday. Look for the open gap above at 13300(weekly R1 pivot point) as a possible dead cat bounce target, and 12975(weekly S1 pivot point) gap below for support.

Back on October 5th I said look for a big pullback on the NDX at the Yearly R3 pivot point(2870). The NDX now has pulled back 200+ pts. to the YR2 pivot point and the 200 day moving average. Price usually moves from Pivot point to pivot point ie: YR3 to YR2. Fridays action on the 200 day looks pretty bullish for the NDX for the coming week. Plus full moons are usually a buy signal. There are some big open gaps below at 2625 if the 200 day fails.

This chart shows how price reverse's around new moons and full moons. Not 100% exact, but odds favor it. (thanks to Omega for this chart)
Red arrow=New moon
Blue arrow=Full moon
H A P P Y H A L L O W E E N

Monday, October 22, 2012
Make or break time

The Dow Jones and S&P indexes both closed last Friday on the 50dma and the old resistance level from last spring. Will it be support again, like it was last week, or will it break down? If we break down next strong support/demand level is 13055(MS1) and open gap. We should know very soon.....like today! If we hold we might rally back up to the open gap at 13550. Watch AAPL for a clue.
Updated:
 The 50 day broke this week after a double top at the yearly R3 pivot point. Look for a pullback to the 1400 open gap or monthly S1 at 1392. Open gap 1428 above.
Updated:

Sunday, October 21, 2012
AAPL in trouble

Apple's stock price has not closed below the 4hr 200 ma this year until last Friday. This is not good. Watch for next support at the 200dma at $585 and now the 4hr 200 becomes resistance at $630.
update: Apple dipped below $600 last week and I'm watch the $585-$590 (200 day) for support.
update: Apple dipped below $600 last week and I'm watch the $585-$590 (200 day) for support.
Thursday, October 18, 2012
XLF possible HNS at YR1 and Cam H4 pivots

Monday, October 15, 2012
CL possible IHS setting up

I am seeing a possible inverse head and shoulders(IHS) pattern setting up on Nov crude oil futures.Watch $89.00- $89.50 this week for a right shoulder confirmation.
Update: IHS pattern was negated this past week.
Update: IHS pattern was negated this past week.
Sunday, October 14, 2012
Opex week

My ES double top call last week at the Yearly R3 pivot point was pretty good. We drop 5 days straight down to the 50day moving average. We probably need to consolidate this move. I'm looking for the 50 day to hold. This being Opex week, will we pin 1400 or 1450 or both?
Wednesday, October 10, 2012
Apple investors chart

Apple's stock has had a big run since the market bottomed in March of 2009. Since then the stock has been riding the 10 month moving average up(I tweeted y'day the 8 month but the 10 month works too). If your an Apple investor, watch for a break below the 10 month moving average to take some profits. The monthly chart is also showing a possible "head and shoulders top" in the making. It may take another 3-12 months to make the right shoulder. In the meantime watch $585(10 month ma).
Friday, October 5, 2012
ES double top YR3

NDX testing YR3 too=bearish
Wednesday, October 3, 2012
Yearly pivot points rock!

key:
YR1=Yearly R1
YR2=yearly R2
YS1=yearly S1
Monday, October 1, 2012

Caution this October

The Dec ES Yearly R3 pivot point is still resistance. The new monthly R1 pivot is at 1472. October is normally a green(up) month. It has only been down 3 of the past 11 years. But I still feel we need to retest the old resistance of 13300 and 1425. Maybe even retest 1400 before the rally kicks in again later in the month. It feels like the market wants to go to 1530 by the end of the year.
Monday, September 24, 2012
December ES @YR3

The S&P futues(Dec) has ran into resistance at the year R3 pivot point and the monthly R2 pivot point. I said last week look for a pullback. We are finally getting one in pre market today. Look for a pb to 1425-1430 this week.
the NDX also kissed the yearly R3 pivot point last week(see my tweet). All 3 indexes are at major resistance(yearly R pivots)!
DJIA YH4 and MR2

Last week the Camarilla yearly H4 pivot point and the monthly R2 pivot was resistance(sellers). I'm still looking for a pullback any day now. A pullback would be healthy and set us up for a Xmas rally.
Tuesday, September 18, 2012
long term Head and shoulders topping pattern

The S&P yearly chart shows a possible long term(12 yrs) head and shoulders topping pattern. In 2000 and 2007 the market topped out when it got a 1500 handle. The 2012 yearly R2 pivot point is at 1530. If the rally fails there and doesn't make a new all time high, then look out below in 2013! Head and shoulders patterns are very powerful reversal patterns.
Monday, September 17, 2012
2012 Gold pivots
It looks like Gold's next resistance will be at 1888(YR1). Here are Gold's 2012's pivot points.
http://mpgtrading.blogspot.com/2012/01/gold-2012-pivots.html
http://mpgtrading.blogspot.com/2012/01/gold-2012-pivots.html
Sunday, September 16, 2012
INDU YH4/Mr2 pivots

Dec ES kissing YR3

Sunday, September 9, 2012
Roll over week
The September index futures expire next week and we will see volume roll over to the December contract later this week.
Monday, August 27, 2012

4th test of yr1

Sunday, August 19, 2012
S&P back at YH4

the S&P 500 index is back at the yearly Camarilla H4 pivot point. That was the high back in late March. A breakout here could take up up to the yearly R2 pivot point at 1530. A pullback could take us back down 1375-1350.
Wednesday, August 15, 2012
Monthly R1 pivot
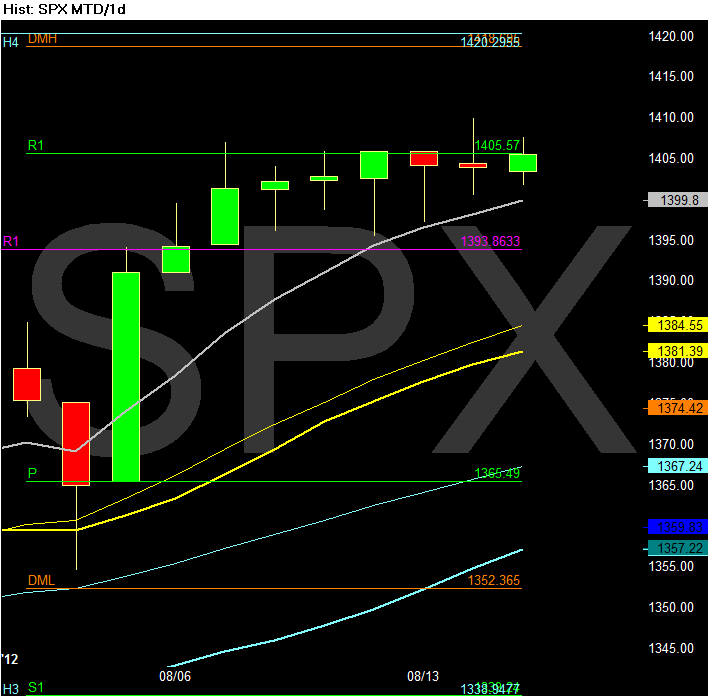
The S&P rally has stalled at the monthly R1 pivot point at 1405.50. That's where the smart money is taking profits, after buying on the monthly pivot point at 1365, a few weeks ago. I would not be surprised to see a pullback to the 20 day moving average at 1381-1385. The 8 day has been support and a break there would signal a test of the 20 day. Until then, buy the dips!
Sunday, August 12, 2012
Cooper rule 4 ?

Jeff Cooper wrote a book called "Hit and run Trading" that says "on the 4th time that support OR resistance is tested, it will finally break". The Dow has tested the yearly R1 pivot point(13,310) 3x times last spring. We are only 100 points away from a 4th test and new high of the year. Or will the monthly R1 pivot point(13295) be resistance again?
Sunday, August 5, 2012
S&P back at YR1

The S&P 500 re-tested the yearly R1 pivot point(1394) on Friday. The past 9 mondays in a row have been down days. Will we make it 10 weeks in a row tomorrow(8/6)? Watch for a possible double top failure up here. Need to see a close over 1420 for new bull market. If we do close over 1420(YH4) there is a open gap at 1478 from Dec 2007, and the yearly R2(YR2) pivot point is at 1530.
P.S. Sorry about the lack of updates. I'm on a working vacation this month. Rocky Mtn. High!
P.S. Sorry about the lack of updates. I'm on a working vacation this month. Rocky Mtn. High!
Sunday, July 29, 2012
Bradley Model Right on time!

Right on time! The Bradley model 7/28 trend change date looks like it will be to the upside, not the downside, like the 2012 Bradley graph shows. The Bradley model major dates tell us when to look for a trend change, not the direction(many times the direction is the same as the graph). Next resistance I see is a gap at 13200 and the monthly R1 pivot point is close by at 13197. We get new monthly pivot points for August this Wednesday. For this rally to have legs, we need to stay above 13,000 or we could fall back to 12,675(open gap). A close above 13,310(R1), and we could rally to the yearly R2 pivot point at 14,400(1530 on the S&P).
Subscribe to:
Posts (Atom)
