Friday, May 7, 2010

it's not over

Yesterday's 1000 pt. sell off is a warning of how manipulated the stock market is. If 1 person or a bunch of super computers can cause this, why will people want to invest? Even though most of yesterdays sell off trade's where negated, I don't see this as a long term buying opp. I think we will consolidate and maybe retest the 50dma, before falling again. I think 10,000 on the Dow and 1050 on the S&P needs to be retested. "Come May and go away" maybe the best strategy this summer.

Tuesday, May 4, 2010

10% correction started?

In 1980, 1990, and in 2000, all those years that ended with a zero "0", there was a 10%+ mid year correction. I believe we are seeing the beginning of 2010's mid year correction. We tested the 50dma(1168) today, per my call a few days ago. A close below the 50dma(1168 on the S&P), will spell trouble down to the 150dma (1110).

I've been writing about some warning signs the past few weeks.
1) in the "danger zone" with 80%+ of stocks trading above their 50 dma.
2) June Index futures contracts, all at the Yearly R1 or R2 pivots.
3) the 61.8% Fibonacci re-tracement area...aka the "Ambush Zone".
4) Big price swings ie: we had 5 days of triple digit up/down days very close to each other = topping action.

These warning signals told us NOT to look for new long positions, but to start raising cash. Professional traders buy support and sell resistance. We hit major resistance at the Yearly R Pivots!

Is the rally over? yes, the big down volume is telling us the smart/big money is pulling out. They maybe be back buying in a couple of days, weeks or months.


Sunday, May 2, 2010

Topping action

Last week, the S&P is showing signs of topping action, and a Head and Shoulders top at YR1(blue circles) I still think we will see a pullback to 1168 this week.

Tuesday, April 27, 2010

Yearly R pivots stop the rally

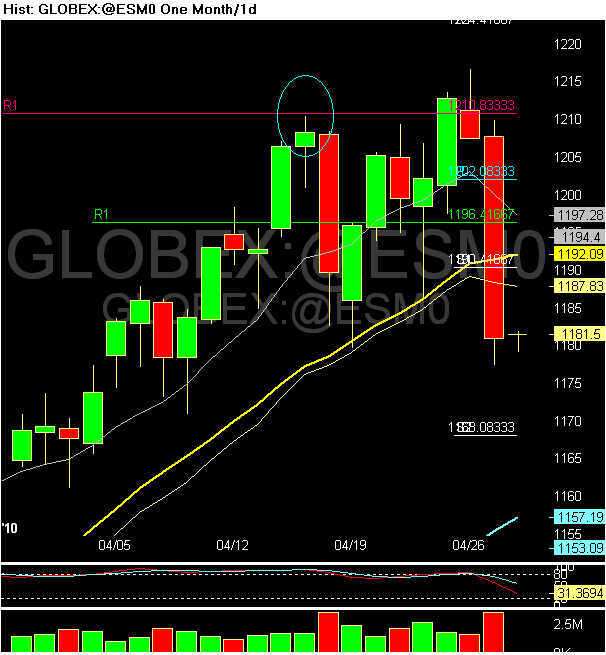
All three of the June futures indexes, failed at the yearly R1 or R2 pivots, as per yesterdays blog. On the S&P June futures chart above, the YR1 Pivot was at 1211(purple line marked R1). We now have a trend change taken shape, since we closed below the 20dma(the yellow lines). I'm looking to short a test of the 20 dma at 1192ish.....and or 11032 on the Dow Jones. My guess is the 50 dma's(blue lines) is next support @1157/10750.

Monday, April 26, 2010

NDX futures tested YR1 today

NDX June futures kissed the yearly R1 pivot today at 2058. Look for a pullback to the weekly pivot at 2031 and 8dma(gray line).