Sunday, October 25, 2009

Halloween week

This coming week, we should not see any Halloween ghosts or goblin's. With many Mutual Funds year end this week, money managers should keep the S&P 500 trading between 1065 and 1100. We are very close to major resistance on the Dow and S&P. First, we have the 500 day moving averages coming in at 10,325 on the Dow, and at 1120 on the S&P. Second, we have the 50% retracement fib(mid) from the 2007 high to the 2009 low, at 10,300 on the Dow, and at 1120 on the S&P. I'm hearing that many hedge funds are close to being fully hedged up here. In my opinion, this is NOT the time to be looking for NEW LONG POSITIONS. Look at protecting your profits!

Microsoft chart

Last friday, Microsoft gapped up at the opened and closed the day on it's low. As seen in the chart above, this happened on very heavy volume. This is a textbook example of a blow off top on Microsoft. The smart money that bought at $20, was selling to the dumb money(retail investors) $29.

Bradley Model 2010


The 2010 Bradley Model chart, is calling for a big massive move, in the spring and summer of 2010. Will it be a retest of this years lows? Or another rip roaring rally higher? We'll know the direction by the end of March 2010. Which ever direction it goes, it will be a big massive move. Bigger than this years move! Maybe the biggest in history!

Tuesday, October 20, 2009

Bradley Model vs S&P

The next Major Bradley date is 0n November 9th, 2009, and the new trend will stay in tact until the next Major Bradley date on March 1, 2010(see new post above). Since we have been in an up trend, since the last major Bradley date on July 15, 2009, I think we will start a sideways trend or down trend. The Model has an uncanny way predicting trend changes and chaos. ....just look at the chart above!

for more info on the Bradley Model, click this link.


Sunday, October 18, 2009

S&P at MR1

The S&P 500 last week ran into resistance (sellers/profit taking) at the monthly R1 pivot. And came very close to filling an open gap from last October's melt down. My new target for this year is at the 50% Fibonacci, which is at 1120. December S&P futures Yearly R1 pivot is at 1136. I feel we'll see 1120- 1136 by December's Quad expiration. We still may see a fast pullback that will be bought. This coming week's trading range should be between 1065-1100.

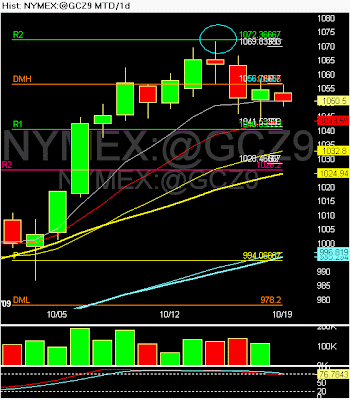
Gold kissed MR2

Last week , Gold's high was at the monthly R2 pivot(blue circle). R2 odds say that will be the high for Gold this month.

Sunday, October 4, 2009

S&P is the top in?

The S&P 500 has run into major resistance at the yearly R1 pivot(purple line marked R1) at 1073/1074. And, it has made a Head and Shoulders pattern up there(see blue arrows at top of chart). Remember, back in early March, the S&P lows where at the yearly S1 pivot. It's normal to see a S1 to R1 move. We see it everyday with daily pivots(ie: see Euro trade post from 10/2).
This coming week, I'm looking for a bounce back up to 1040-1050 that should fail. In the next week or two, I'm looking for a hard fast fall down to monthly S1 at 1005 or monthly S2 at 954. The right shoulder failure, on a head and shoulders pattern, is usually very fast, because it traps the rookie traders. This selloff could setup up for a November - Xmas rally, and re- test the years high. Use a close above 1050 as your stop loss, if your short.
I have NOT heard anyone on CNBC or Bloomberg talk about this Head N Shoulders pattern, so maybe it will play out this time.

Saturday, October 3, 2009

Gold is the top in?

Gold kissed the yearly R2 pivot(purple line marked R2) a few weeks ago at 1026. In my opinion, that will be the high on gold for this year. Gold is now making a head and shoulders pattern(blue arrows), and I'm looking for a big pullback in price, and shake the grannies out. There is no Inflation, we still have Deflation going on. Gold always ends in tears... it has for thousands of years!

Friday, October 2, 2009

Euro pivot play today

The Euro today, has gone from a low on the S1 pivot(blue circle, green line marked S1), to the high at the R1 pivot(blue circle, green line marked R1), for a 150 pip move. Professional day traders use Pivots as there entry and exits. Go long on S1 and sell 1/2 at the P, and the other half at R1. Buy fear and sell greed! Pivots are your best intraday set-ups to play.

Thursday, October 1, 2009

Dow hits the 400dma/20 month

Most traders have never heard of the 400 day moving average. It's one of my favorites, as it is the same as a monthly 20 moving average, on a monthly chart. The chart above shows the Dow kept testing the 400 dma(brown line) last month. Now it looks like were going to get a correction off the head and shoulders top. 9450 is the next major support area. The new monthly S1 pivot is at 9331 and the monthly R1 is at 9996.