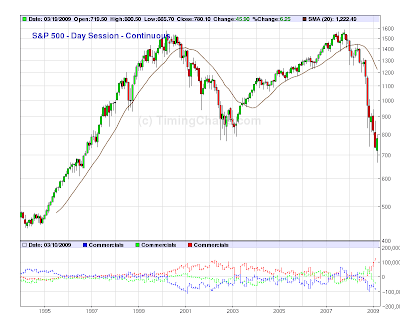
 For longer term investors, you only need to look at a monthly S&P 500 chart with the 20month moving average. See in the chart how the 20 month(brown line) was support for many years......and when it broke.....that was the sell signal to get out of all stocks.
Friday, March 20, 2009
Long term investors
 For longer term investors, you only need to look at a monthly S&P 500 chart with the 20month moving average. See in the chart how the 20 month(brown line) was support for many years......and when it broke.....that was the sell signal to get out of all stocks.

