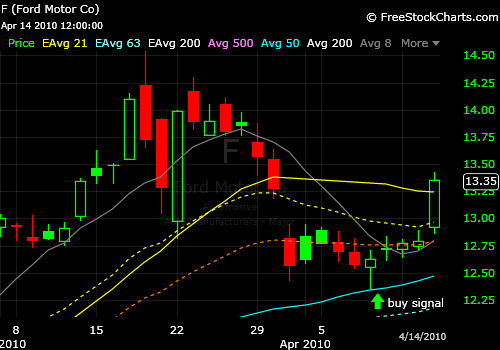
 Last week on www.freestockcharts.com, I posted in the friends area, I had bought some F(Ford) May 13 calls on the test of the 50 dma(blue line, green arrow buy signal). They have now doubled in 5 days. Up 100%
Wednesday, April 14, 2010
F may 13 calls doubled in 5 days
Last week on www.freestockcharts.com, I posted in the friends area, I had bought some F(Ford) May 13 calls on the test of the 50 dma(blue line, green arrow buy signal). They have now doubled in 5 days. Up 100%
Sunday, April 11, 2010
Rally continues but beware

The S&P continues to find support on the 8 day moving average(grey line). With Options Expiration this Friday, I'm looking for resistance @1210(yearly R1 pivot on the ES June contract) on the S&P and 12100 on the Dow Jones(12065 on the futures), and support coming in at 11800 and 1165. Beware, we are in the danger zone and we will see a reversal within 60-90 days or sooner, per last weeks chart. The market has never stayed in the danger zone(80% + stocks above their 50 dma for more than a few months. I am not looking for new long term positions up here. The best risk/reward spot to buy, is when the market does pull back to the yellow(20dma) or blue(50dma) line's an the chart above.
Tuesday, April 6, 2010
the Danger zone

This chart shows what percent of stocks are trading above their 40 dma. The chart also shows when the percentage gets above 80%, to look for a pullback soon. We are actually at 90%, per CNBC. I'm looking for a pullback sometime soon to test the 20 dma or 50 dma. That will be a good buying opp.
Sunday, April 4, 2010
The rally continues
 Sorry for the lack of updates, but nothing has changed. The indexes continue to find support on the 8dma(grey line). Continue to buy pullbacks there, until a close below it. Then look for support on the 20 dma(yellow line).
Subscribe to:
Posts (Atom)