On December 12, 2009 I wrote that C was a buy at $3.12. It has now rallied almost $2 and is testing the Yearly R1 pivot(purple line R1) at $5.02. ...up 60%. I still like C, but look for a pullback to the 20($4.66) or 50dma($4.12).
Sunday, April 25, 2010
CitiGroup testing YR1
On December 12, 2009 I wrote that C was a buy at $3.12. It has now rallied almost $2 and is testing the Yearly R1 pivot(purple line R1) at $5.02. ...up 60%. I still like C, but look for a pullback to the 20($4.66) or 50dma($4.12).
Follow the Yellow Brick Road

When the good witch told Dorothy to "Follow the yellow brick road", in the Wizard of Oz, she must have meant the 20 day moving average (yellow line on the chart above). The S&P has not closed below the 20dma(yellow line) since the major Bradley Model turn date on March 1st. Smart money bought the pullback last week on the 20 dma at 1188. With the end of the month this week, we should see the Monthly R2 pivot hit at 1225, unless we get a full moon reversal back down to 1188. Use a close below the 20 dma(yellow line), as your exit plan on short term trades.
P.S. we are still in the danger zone with 80%+ of stocks above their 50 day moving average. We are also close to the 61.8% retracement fib, from the 2007 high to 2009 lows @1230ish.
Friday, April 23, 2010
Natty yearly S2 pivot holds

May Natgas futures held the Yearly S2 pivot(purple line marked s2). Coincidence? Not! The Monthly Pivot at $4.21(yellow line marked P) is next resistance/upside target. Are the lows for natty in for this year?
Wednesday, April 14, 2010
F may 13 calls doubled in 5 days
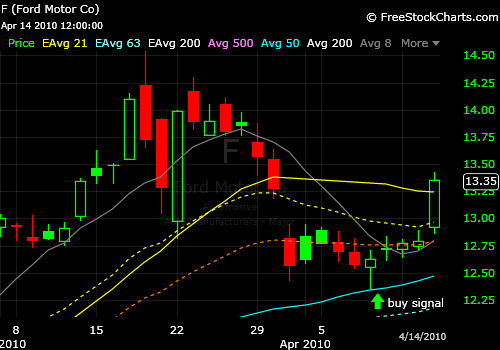 Last week on www.freestockcharts.com, I posted in the friends area, I had bought some F(Ford) May 13 calls on the test of the 50 dma(blue line, green arrow buy signal). They have now doubled in 5 days. Up 100%
Subscribe to:
Posts (Atom)