

Wednesday, May 30, 2012
Crude oil support
Thursday, May 24, 2012
Euro yearly support pivots

I'm looking for the Eur/usd to find support on the yearly S1 pivot point at 1.2232, or at the yearly Camarilla pivot point at 1.2387
U.S. Dollar index close to resistance

U.S. Dollar index is getting close to the yearly Camarilla H3 pivot point. The yearly pivot point(P) was the low this year so we should see a test of the yearly R1 pivot point at $83.42.
S&P MS3 pivot caught the fall

NDX Ms3 caught the fall

Wednesday, May 23, 2012
Crude oil Yr1 to YS1?

Since the yearly R1 pivot point was the high this year on July crude oil, and the price is now below the yearly Pivot(P), the next support area is the yearly S1 pivot point at $82.95.
Tuesday, May 22, 2012
DJIA 1,000 point fall

The Dow had a dead cat bounce on Monday, after falling 1,000 points, from the high of the year. My target is still the yearly Pivot Point (P) at 11836. The Yearly R1 pivot point was the high this year, so it only makes sense to come back down to test the yearly P. Before that watch for next support on the 200 day(12200) and there is an open gap at 12217 from the close on 12/30/2012. Look for shorting opps on this bounce....imo.
Ford Monthly S2

Ford has found support on the Monthly S2 pivot point. The 1000sma(weekly 200) is below at $9.78. Ford could be a bottom here.
Groupon YDMH - YDML

Groupon(GRPN), this years high was at Demarks yearly DMH pivot point and the low this year was on Demarks yearly DML pivot point. I like GRPN as long as it holds the 20 day(yeallow line).
Thursday, May 17, 2012
Gold on yearly DML

Wednesday, May 16, 2012
U.S. Dollar index at MR3

The U.S. Dollar has had a big run this month. That's why oil and gold prices are down. Today the dollar index is testing the monthly R3 pivot point. It probably will pullback here a little before going up to the Yearly R1 pivot point at $82.87.
Tuesday, May 15, 2012
CLN2 held the YPP
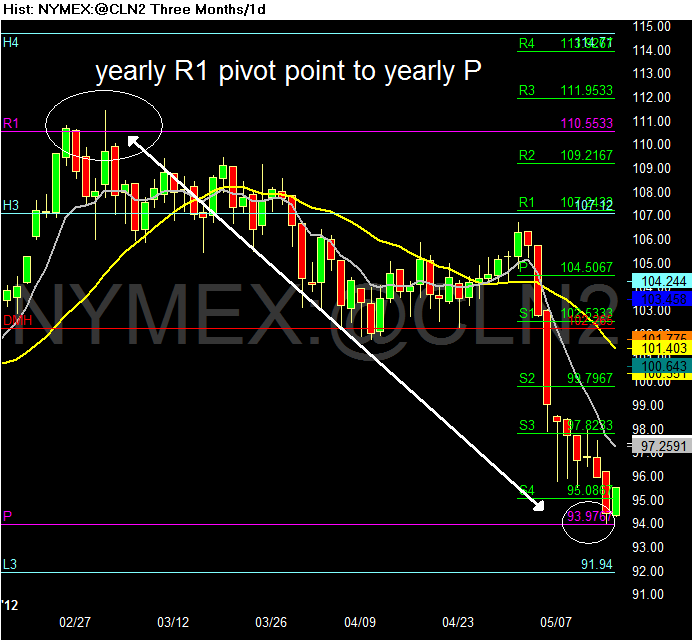
Looks like crude oil found support on the Yearly pivot point(YPP). Pro oil traders must be using yearly pivots charts. Bull harami pattern today is bullish on the YPP. I read that they are going to reverse the oil flow from Texas to Cushing, OK this week. I'm not sure what effect that will have on prices. After falling 15% from the high this year, we shoud see a short covering bounce soon.
S&P YH4 to YH3

The S&P's rally this year stopped at the Camarilla yearly H4 pivot point. That's where smart money either sold their longs or they went short there. Now the market has pulled back to the Camarilla yearly H3 pivot point. Possible short term support here. If we break down, there are open gaps below at the at 1325, 1312 and above at 1350 and 1390. Also the Monthly S2 pivot point is 1327.
Monday, May 14, 2012
Crude oil on YPP support

JPM on support

Opex week

Friday, May 11, 2012
IBM YH4 to YH3

Thursday, May 10, 2012
Gold Futs on monthly S2

Demarks monthly pivots in control

Tuesday, May 8, 2012
S&P Camarilla YH4 to YH3 pivot points

The Camarilla yearly H4(YH4) pivot point was the high so far this year. We should pullback to the yearly H3(YH3) pivot point at 1339.
DJIA YR1 to YPP?

Saturday, May 5, 2012
12700 needs to hold

Friday, May 4, 2012
Ford 1000 day moving average

Apple not looking good

Apple looks like it is about to roll over to the downside. It is having a problem finding buyers on the 50 day moving average. Tom Demark's monthly low pivot point is where Apple found support in April(see earlier posts below). This week it is testing the new(May) Demark's monthly low pivot(DML) at $579. Will that be the low again?
The monthly pivot / 20 day at $595 is now resistance and the monthly S1 pivot point at $545 is next support if $579 breaks. There are open gap's at $562 and $545 that need filling.
Thursday, May 3, 2012
Yearly R1 pivot point is still da boss

Look out below.... Joe!

Come May and go AWAY!
Tuesday, May 1, 2012
Natty looking bullish

Subscribe to:
Posts (Atom)
